|
| | QCPStatisticalBox (QCPAxis *keyAxis, QCPAxis *valueAxis) |
| |
| QSharedPointer< QCPStatisticalBoxDataContainer > | data () const |
| |
| double | width () const |
| |
| double | whiskerWidth () const |
| |
| QPen | whiskerPen () const |
| |
| QPen | whiskerBarPen () const |
| |
| bool | whiskerAntialiased () const |
| |
| QPen | medianPen () const |
| |
| QCPScatterStyle | outlierStyle () const |
| |
| void | setData (QSharedPointer< QCPStatisticalBoxDataContainer > data) |
| |
| void | setData (const QVector< double > &keys, const QVector< double > &minimum, const QVector< double > &lowerQuartile, const QVector< double > &median, const QVector< double > &upperQuartile, const QVector< double > &maximum, bool alreadySorted=false) |
| |
| void | setWidth (double width) |
| |
| void | setWhiskerWidth (double width) |
| |
| void | setWhiskerPen (const QPen &pen) |
| |
| void | setWhiskerBarPen (const QPen &pen) |
| |
| void | setWhiskerAntialiased (bool enabled) |
| |
| void | setMedianPen (const QPen &pen) |
| |
| void | setOutlierStyle (const QCPScatterStyle &style) |
| |
| void | addData (const QVector< double > &keys, const QVector< double > &minimum, const QVector< double > &lowerQuartile, const QVector< double > &median, const QVector< double > &upperQuartile, const QVector< double > &maximum, bool alreadySorted=false) |
| |
| void | addData (double key, double minimum, double lowerQuartile, double median, double upperQuartile, double maximum, const QVector< double > &outliers=QVector< double >()) |
| |
| virtual QCPDataSelection | selectTestRect (const QRectF &rect, bool onlySelectable) const Q_DECL_OVERRIDE |
| |
| virtual double | selectTest (const QPointF &pos, bool onlySelectable, QVariant *details=0) const Q_DECL_OVERRIDE |
| |
| virtual QCPRange | getKeyRange (bool &foundRange, QCP::SignDomain inSignDomain=QCP::sdBoth) const Q_DECL_OVERRIDE |
| |
| virtual QCPRange | getValueRange (bool &foundRange, QCP::SignDomain inSignDomain=QCP::sdBoth, const QCPRange &inKeyRange=QCPRange()) const Q_DECL_OVERRIDE |
| |
| | QCPAbstractPlottable1D (QCPAxis *keyAxis, QCPAxis *valueAxis) |
| |
| virtual | ~QCPAbstractPlottable1D () |
| |
| virtual int | dataCount () const Q_DECL_OVERRIDE |
| |
| virtual double | dataMainKey (int index) const Q_DECL_OVERRIDE |
| |
| virtual double | dataSortKey (int index) const Q_DECL_OVERRIDE |
| |
| virtual double | dataMainValue (int index) const Q_DECL_OVERRIDE |
| |
| virtual QCPRange | dataValueRange (int index) const Q_DECL_OVERRIDE |
| |
| virtual QPointF | dataPixelPosition (int index) const Q_DECL_OVERRIDE |
| |
| virtual bool | sortKeyIsMainKey () const Q_DECL_OVERRIDE |
| |
| virtual int | findBegin (double sortKey, bool expandedRange=true) const Q_DECL_OVERRIDE |
| |
| virtual int | findEnd (double sortKey, bool expandedRange=true) const Q_DECL_OVERRIDE |
| |
| virtual QCPPlottableInterface1D * | interface1D () Q_DECL_OVERRIDE |
| |
| | QCPAbstractPlottable (QCPAxis *keyAxis, QCPAxis *valueAxis) |
| |
| virtual | ~QCPAbstractPlottable () |
| |
| QString | name () const |
| |
| bool | antialiasedFill () const |
| |
| bool | antialiasedScatters () const |
| |
| QPen | pen () const |
| |
| QBrush | brush () const |
| |
| QCPAxis * | keyAxis () const |
| |
| QCPAxis * | valueAxis () const |
| |
| QCP::SelectionType | selectable () const |
| |
| bool | selected () const |
| |
| QCPDataSelection | selection () const |
| |
| QCPSelectionDecorator * | selectionDecorator () const |
| |
| void | setName (const QString &name) |
| |
| void | setAntialiasedFill (bool enabled) |
| |
| void | setAntialiasedScatters (bool enabled) |
| |
| void | setPen (const QPen &pen) |
| |
| void | setBrush (const QBrush &brush) |
| |
| void | setKeyAxis (QCPAxis *axis) |
| |
| void | setValueAxis (QCPAxis *axis) |
| |
| Q_SLOT void | setSelectable (QCP::SelectionType selectable) |
| |
| Q_SLOT void | setSelection (QCPDataSelection selection) |
| |
| void | setSelectionDecorator (QCPSelectionDecorator *decorator) |
| |
| void | coordsToPixels (double key, double value, double &x, double &y) const |
| |
| const QPointF | coordsToPixels (double key, double value) const |
| |
| void | pixelsToCoords (double x, double y, double &key, double &value) const |
| |
| void | pixelsToCoords (const QPointF &pixelPos, double &key, double &value) const |
| |
| void | rescaleAxes (bool onlyEnlarge=false) const |
| |
| void | rescaleKeyAxis (bool onlyEnlarge=false) const |
| |
| void | rescaleValueAxis (bool onlyEnlarge=false, bool inKeyRange=false) const |
| |
| bool | addToLegend (QCPLegend *legend) |
| |
| bool | addToLegend () |
| |
| bool | removeFromLegend (QCPLegend *legend) const |
| |
| bool | removeFromLegend () const |
| |
| | QCPLayerable (QCustomPlot *plot, QString targetLayer=QString(), QCPLayerable *parentLayerable=0) |
| |
| virtual | ~QCPLayerable () |
| |
| bool | visible () const |
| |
| QCustomPlot * | parentPlot () const |
| |
| QCPLayerable * | parentLayerable () const |
| |
| QCPLayer * | layer () const |
| |
| bool | antialiased () const |
| |
| void | setVisible (bool on) |
| |
| Q_SLOT bool | setLayer (QCPLayer *layer) |
| |
| bool | setLayer (const QString &layerName) |
| |
| void | setAntialiased (bool enabled) |
| |
| bool | realVisibility () const |
| |
| virtual | ~QCPPlottableInterface1D () |
| |
|
| virtual void | draw (QCPPainter *painter) Q_DECL_OVERRIDE |
| |
| virtual void | drawLegendIcon (QCPPainter *painter, const QRectF &rect) const Q_DECL_OVERRIDE |
| |
| virtual void | drawStatisticalBox (QCPPainter *painter, QCPStatisticalBoxDataContainer::const_iterator it, const QCPScatterStyle &outlierStyle) const |
| |
| void | getVisibleDataBounds (QCPStatisticalBoxDataContainer::const_iterator &begin, QCPStatisticalBoxDataContainer::const_iterator &end) const |
| |
| QRectF | getQuartileBox (QCPStatisticalBoxDataContainer::const_iterator it) const |
| |
| QVector< QLineF > | getWhiskerBackboneLines (QCPStatisticalBoxDataContainer::const_iterator it) const |
| |
| QVector< QLineF > | getWhiskerBarLines (QCPStatisticalBoxDataContainer::const_iterator it) const |
| |
| void | getDataSegments (QList< QCPDataRange > &selectedSegments, QList< QCPDataRange > &unselectedSegments) const |
| |
| void | drawPolyline (QCPPainter *painter, const QVector< QPointF > &lineData) const |
| |
| virtual QRect | clipRect () const Q_DECL_OVERRIDE |
| |
| virtual QCP::Interaction | selectionCategory () const Q_DECL_OVERRIDE |
| |
| void | applyDefaultAntialiasingHint (QCPPainter *painter) const Q_DECL_OVERRIDE |
| |
| virtual void | selectEvent (QMouseEvent *event, bool additive, const QVariant &details, bool *selectionStateChanged) Q_DECL_OVERRIDE |
| |
| virtual void | deselectEvent (bool *selectionStateChanged) Q_DECL_OVERRIDE |
| |
| void | applyFillAntialiasingHint (QCPPainter *painter) const |
| |
| void | applyScattersAntialiasingHint (QCPPainter *painter) const |
| |
| virtual void | parentPlotInitialized (QCustomPlot *parentPlot) |
| |
| virtual void | mousePressEvent (QMouseEvent *event, const QVariant &details) |
| |
| virtual void | mouseMoveEvent (QMouseEvent *event, const QPointF &startPos) |
| |
| virtual void | mouseReleaseEvent (QMouseEvent *event, const QPointF &startPos) |
| |
| virtual void | mouseDoubleClickEvent (QMouseEvent *event, const QVariant &details) |
| |
| virtual void | wheelEvent (QWheelEvent *event) |
| |
| void | initializeParentPlot (QCustomPlot *parentPlot) |
| |
| void | setParentLayerable (QCPLayerable *parentLayerable) |
| |
| bool | moveToLayer (QCPLayer *layer, bool prepend) |
| |
| void | applyAntialiasingHint (QCPPainter *painter, bool localAntialiased, QCP::AntialiasedElement overrideElement) const |
| |
To plot data, assign it with the setData or addData functions. Alternatively, you can also access and modify the data via the data method, which returns a pointer to the internal QCPStatisticalBoxDataContainer.
Additionally each data point can itself have a list of outliers, drawn as scatter points at the key coordinate of the respective statistical box data point. They can either be set by using the respective addData method or accessing the individual data points through data, and setting the QVector<double> outliers of the data points directly.
Changing the appearance
The appearance of each data point box, ranging from the lower to the upper quartile, is controlled via setPen and setBrush. You may change the width of the boxes with setWidth in plot coordinates.
Each data point's visual representation also consists of two whiskers. Whiskers are the lines which reach from the upper quartile to the maximum, and from the lower quartile to the minimum. The appearance of the whiskers can be modified with: setWhiskerPen, setWhiskerBarPen, setWhiskerWidth. The whisker width is the width of the bar perpendicular to the whisker at the top (for maximum) and bottom (for minimum). If the whisker pen is changed, make sure to set the capStyle to Qt::FlatCap. Otherwise the backbone line might exceed the whisker bars by a few pixels due to the pen cap being not perfectly flat.
The median indicator line inside the box has its own pen, setMedianPen.
The outlier data points are drawn as normal scatter points. Their look can be controlled with setOutlierStyle
Usage
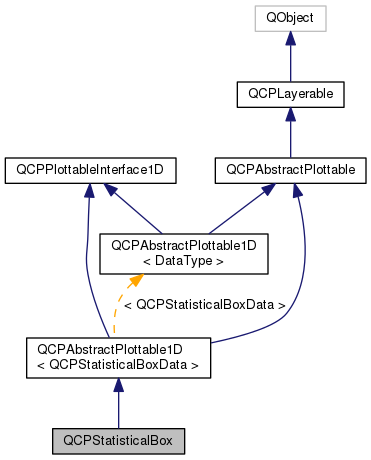
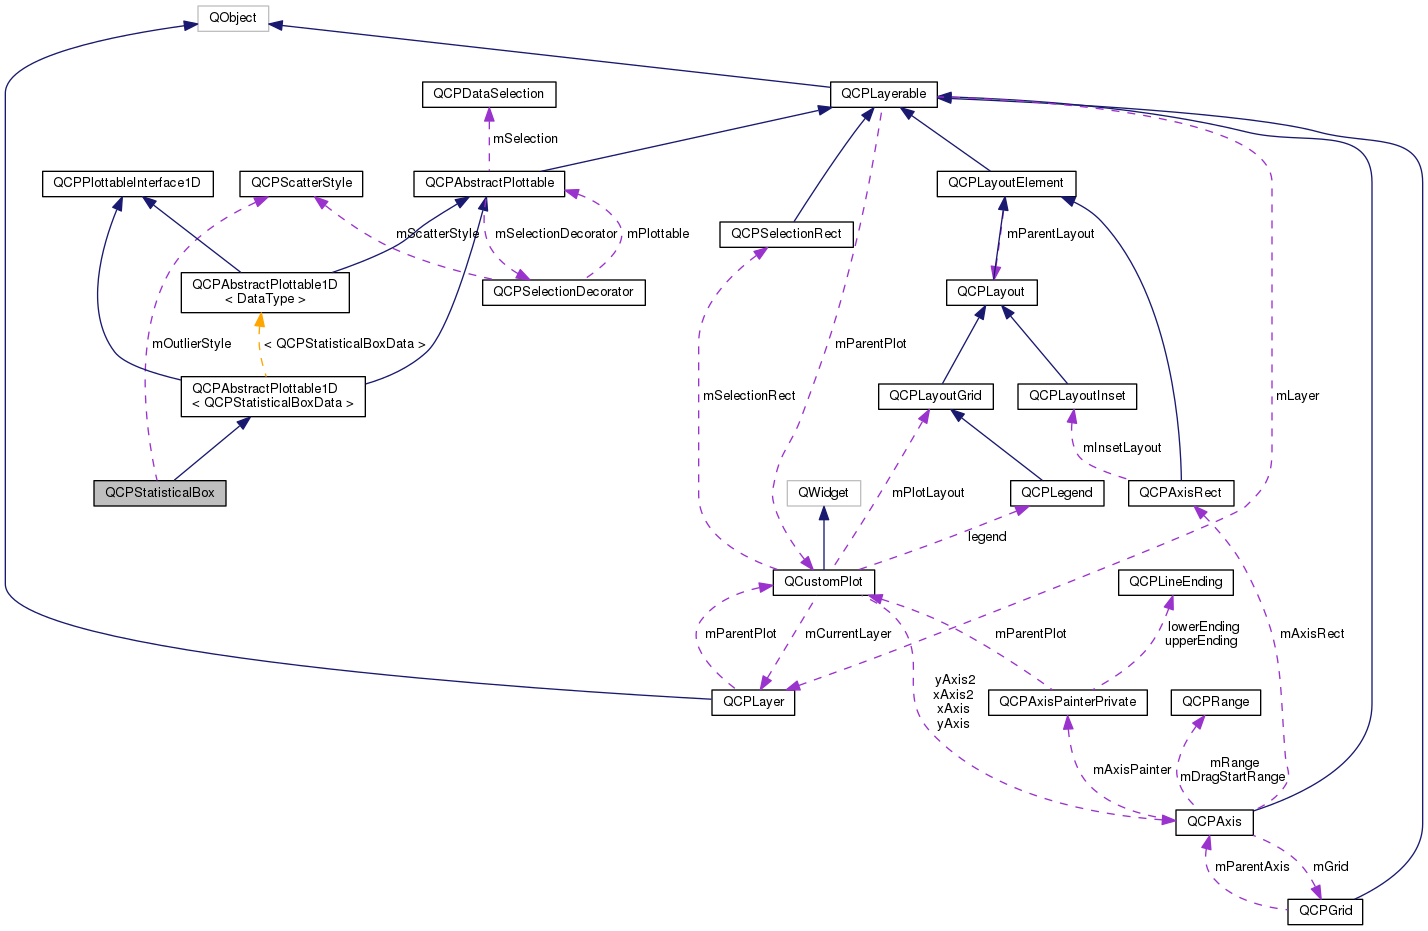
Like all data representing objects in QCustomPlot, the QCPStatisticalBox is a plottable (QCPAbstractPlottable). So the plottable-interface of QCustomPlot applies (QCustomPlot::plottable, QCustomPlot::removePlottable, etc.)
Usually, you first create an instance:
which registers it with the QCustomPlot instance of the passed axes. Note that this QCustomPlot instance takes ownership of the plottable, so do not delete it manually but use QCustomPlot::removePlottable() instead. The newly created plottable can be modified, e.g.:
| void QCPStatisticalBox::addData |
( |
const QVector< double > & |
keys, |
|
|
const QVector< double > & |
minimum, |
|
|
const QVector< double > & |
lowerQuartile, |
|
|
const QVector< double > & |
median, |
|
|
const QVector< double > & |
upperQuartile, |
|
|
const QVector< double > & |
maximum, |
|
|
bool |
alreadySorted = false |
|
) |
| |
To jest metoda przeciążona, udostępniona dla wygody. Różni się od powyższej metody tylko zestawem akceptowanych argumentów.
Adds the provided points in keys, minimum, lowerQuartile, median, upperQuartile and maximum to the current data. The provided vectors should have equal length. Else, the number of added points will be the size of the smallest vector.
If you can guarantee that the passed data points are sorted by keys in ascending order, you can set alreadySorted to true, to improve performance by saving a sorting run.
Alternatively, you can also access and modify the data directly via the data method, which returns a pointer to the internal data container.
Returns the coordinate range that the data points in the specified key range (inKeyRange) span in the value axis dimension. For logarithmic plots, one can set inSignDomain to either QCP::sdNegative or QCP::sdPositive in order to restrict the returned range to that sign domain. E.g. when only negative range is wanted, set inSignDomain to QCP::sdNegative and all positive points will be ignored for range calculation. For no restriction, just set inSignDomain to QCP::sdBoth (default). foundRange is an output parameter that indicates whether a range could be found or not. If this is false, you shouldn't use the returned range (e.g. no points in data).
If inKeyRange has both lower and upper bound set to zero (is equal to QCPRange()), all data points are considered, without any restriction on the keys.
Note that foundRange is not the same as QCPRange::validRange, since the range returned by this function may have size zero (e.g. when there is only one data point). In this case foundRange would return true, but the returned range is not a valid range in terms of QCPRange::validRange.
- Zobacz również
- rescaleAxes, getKeyRange
Implementuje QCPAbstractPlottable.
| void QCPStatisticalBox::setData |
( |
const QVector< double > & |
keys, |
|
|
const QVector< double > & |
minimum, |
|
|
const QVector< double > & |
lowerQuartile, |
|
|
const QVector< double > & |
median, |
|
|
const QVector< double > & |
upperQuartile, |
|
|
const QVector< double > & |
maximum, |
|
|
bool |
alreadySorted = false |
|
) |
| |
To jest metoda przeciążona, udostępniona dla wygody. Różni się od powyższej metody tylko zestawem akceptowanych argumentów.
Replaces the current data with the provided points in keys, minimum, lowerQuartile, median, upperQuartile and maximum. The provided vectors should have equal length. Else, the number of added points will be the size of the smallest vector.
If you can guarantee that the passed data points are sorted by keys in ascending order, you can set alreadySorted to true, to improve performance by saving a sorting run.
- Zobacz również
- addData
 Metody publiczne dziedziczone z QCPAbstractPlottable1D< QCPStatisticalBoxData >
 1.8.11